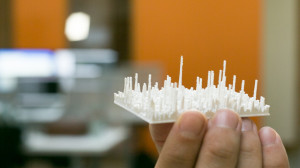
We recently got a Makerbot Replicator Dual, we've had a lot of fun printing little chotskies and cases for raspberry pi and arduino unos. But we thought it was time we did something a little bit more involved. One thing we printed early on was this fantastic 3d model of the classic Joy Division Unknown Pleasures cover. This is right up our street, and it inspired us to see what else could be represented this way....enter Physical Analytics!
We dumped a month worth of our server response time data from our monitoring system and wrote a small nodejs script to massage the data. We then ran the data through an OpenSCAD program to produce this 3d repesentation of our server stats!
Here's a little time-lapse of the printer in action:
We're thinking of other ways we can represent our statistics in 3d form now, there's a variety of ideas being bounced around like making 'slides' for projectors which show different stats depending on the angle that you hold the slide, or globes that show our regional data mapped onto the countries that it relates to. Does having a 3-dimensional view of your data make it more visceral, more real? Let us know what you think.
