One of the challenging things related to building "big data" apps is dealing with messy data sets. At SupplyFrame, we ran into a problem while doing some analysis with K-Means clustering: All interesting features in our data had varying amounts of missing values. It turns out that how the values are missing is significant! Say you knocked out various cells at random: Your analysis won't suffer too much as the contribution to the error is uniform. This is known as Missing Completely at Random (MCAR).
However, let's say you knock out cells more frequently if the user came from a certain country with latency problems. Now, the contribution to error is no longer random. We had to modify the K-Means algorithm to handle this situation. Since we also deal with non-Euclidean distances, we had to adapt K-Means to accept any distance function. Here is a simple Python project that provides a reference implementation:
https://github.com/SupplyFrame/kmeans-pds
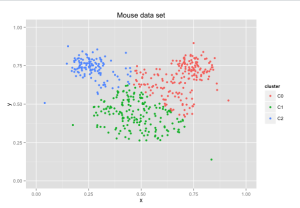
Sample run of this code on the mouse data set from the Wikipedia article on K-Means is given in the following graph:
Stay tuned for a series of articles about how this works and an exploration of the tools used to visualize the results.
