In many real-world applications, "Signals" are typically recorded and represented as time dependent functions. For example, we can record the daily trading price in the stock market, or measuring the hourly temperature in Los Angeles. In order to extract meaningful characteristics of the data, many different transforms have developed to decompose the data into simpler pieces.
The question is: How to design a good transform on the signal we want to analyze? It becomes a classical problem in signal representation- We want to define a transform which provides a "sparse" representation of the signal which capture most or all information of a signal. "Sparseness" is one of the reasons for the extensive use of popular transforms, because they discover the structure of the singal and provide a "compact" representation. In this post, we provide an example that how to analyze the web traffic by Discrete Fourier Transform (DFT).
Website traffic
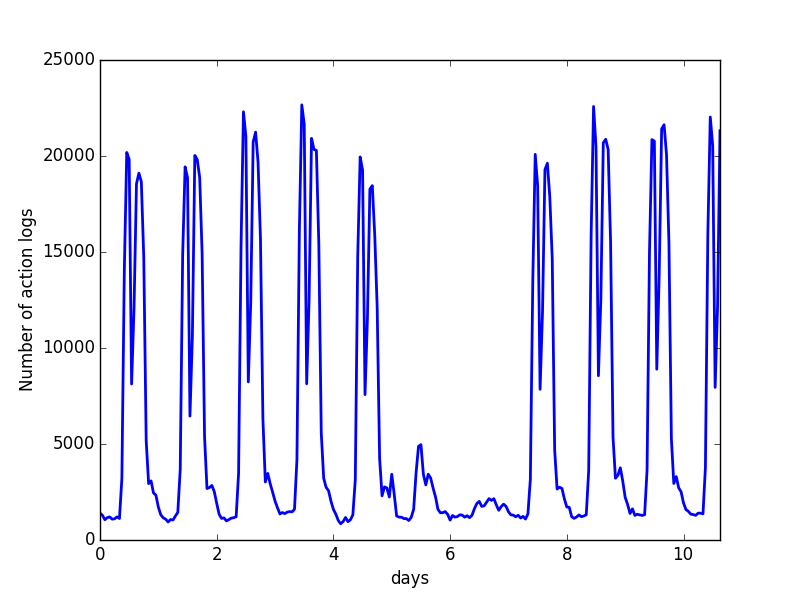
In every hour, we record the total number of user actions in our website and the data is shown in figure 1. This signal seems to be periodic, but the question is: How could we explore the structure? DFT provides a nice tool to represent the discrete time signal into periodic Fourier series. The original signal  can be represented by
\begin{equation}
\label{eq:1}
x(t_n) = \frac{1}{\sqrt{N}} \sum_{k=0}^{N-1} X_k \cdot e^{i 2 \pi k n / N},
\quad n\in\mathbb{Z}\
\end{equation}
where the coefficients of Fourier series  are defined as
\begin{equation}
\label{eq:2}
X_k = \frac{1}{\sqrt{N}} \sum_{n=0}^{N-1} x(t_n) \cdot e^{-i 2 \pi k n / N}, \quad k\in\mathbb{Z}\
\end{equation}
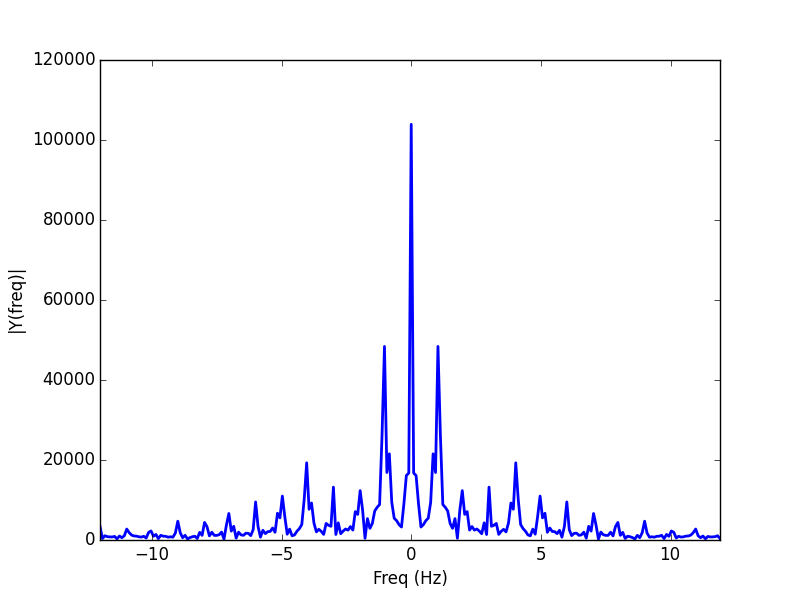
After DFT, we can analyze the energy in each frequency component. The frequency component is given by  , where
  is the sampling frequency. We plot the power spectrum of the data
  in figure 2. The result shows the web traffic is mostly on low-frequency components.
Energy Spectrum
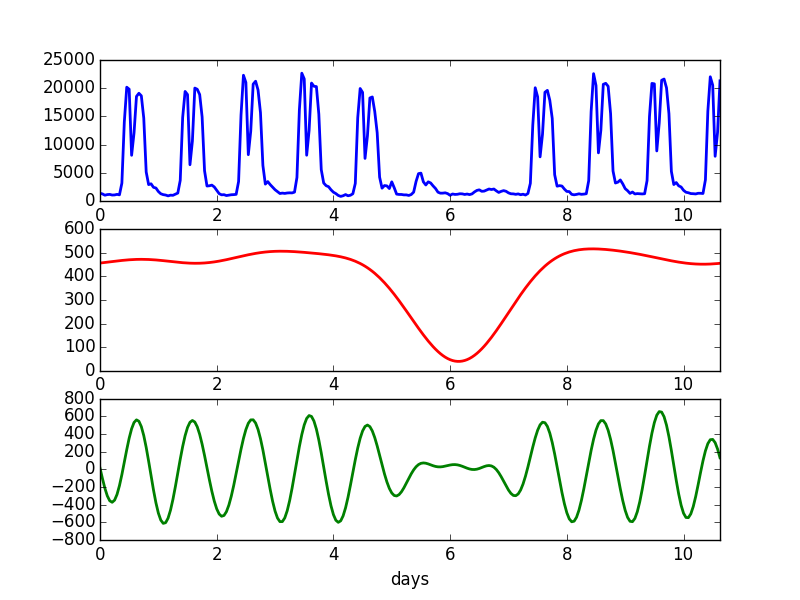
Let's look at different frequency components of the data: We compare different frequency components with the original data: the original signal is shown in figure 3(a), the components with frequency  is in figure 3(b), and components with frequency
  in figure 3(c). Note that the traffic in weekdays is much higher than weekend, and the first components successfully capture the traffic change between weekdays and weekend. Also, the traffic is much higher for working hours than the rest periods, which can be clearly identified for the daily change in the second components.
Signal Components
Based on sparse representation, we can select ``significant'' components for many different applications, i.e, signal de-noising and or pattern recognition. We will introduce the wavelet transform in the next blog.